In brief
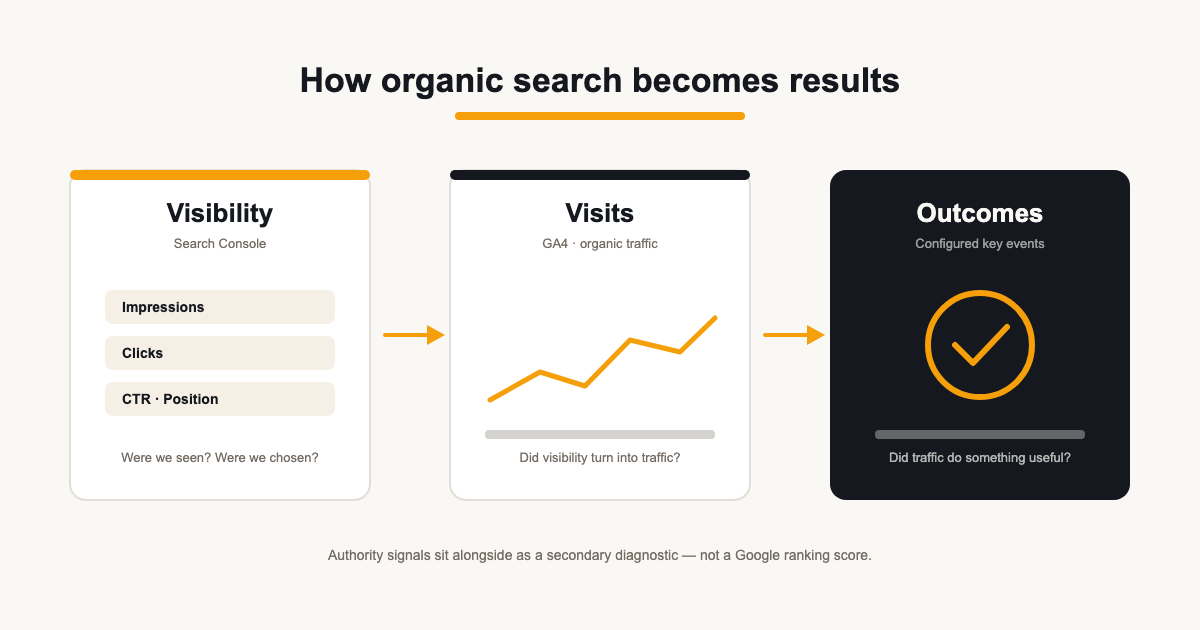
- Report visibility, visits and outcomes in that order — it mirrors how search produces results.
- Average position averages the topmost result across impressions in the selected scope; it is not a fixed rank for every searcher.
- Clicks in Search Console and sessions in GA4 are different measurements; expect a gap.
Contents
- Start from the business question
- Visibility: what Search Console actually measures
- Average position, carefully
- Visits: GA4 organic traffic — and why clicks are not sessions
- Outcomes: configured key events
- Authority: a secondary diagnostic, not a ranking score
- Branded vs non-branded, and the queries you cannot see
- Compare like-for-like periods
- A readable layout — and the limits worth stating
SEO reports go wrong in two directions: they drown the client in every metric available, or they reduce the month to a single ranking number that means less than it appears to. The useful middle ground is a small set of metrics that answer the client's actual questions in order.
This guide covers the metrics worth including — visibility, visits, outcomes and authority — what each one genuinely measures, the definitions that are easy to get subtly wrong, and how to explain them without overselling what the data can prove.
Start from the business question
The client's question is never “what were our metrics?” It is “is SEO working?” — which unpacks into three: are we being seen, are people visiting, and is it producing anything. Your metric set should map one-to-one onto those questions: Search Console for visibility, GA4 for visits, configured key events for outcomes.
Everything else — authority metrics, technical health, query-level detail — is supporting evidence for those three answers. Put it in the report only where it helps explain a movement, not because it exists.
Visibility: what Search Console actually measures
Search Console reports how the site performed in Google Search itself, before anyone reaches the site. Three definitions carry most SEO reports. An impression counts when a link to the site appears in a user's search results. A click counts when the user selects that link. CTR is clicks divided by impressions — the share of appearances that earned a visit.
Impressions and clicks answer different questions, so report both. Rising impressions with flat clicks suggests visibility is growing but listings are not compelling or the queries are wrong; rising clicks on flat impressions suggests the same visibility is being chosen more often. CTR separates those two stories.
Average position, carefully
Average position is the mean position of the site's topmost result across the impressions in scope — a blended statistic, not a literal rank for a specific keyword on a specific day. You can view it by query, by page, or for the whole property, and the number changes meaning with the scope you choose.
Two cautions follow. A property-level average includes queries with different intent and visibility, while a query-filtered view narrows the scope. Neither is a controlled daily rank-tracking measurement. The number can worsen when the site starts appearing for additional queries at lower positions, even as clicks grow; examine the query mix before explaining a movement.
Visits: GA4 organic traffic — and why clicks are not sessions
GA4 counts what arrived and what it did: organic sessions, engagement, landing pages. This is the layer that proves visibility converted into traffic — the metric clients feel, because it is people on their site.
Search Console clicks and GA4 sessions are not expected to match one-to-one. One session can include multiple search clicks, and GA4 organic traffic can include search engines other than Google unless you filter it. Align the property, Google organic source, dates and timezone basis first. Consent, tag coverage, processing and modelling can still affect the comparison. Investigate a new or unusually large gap rather than assuming every difference is harmless.
Outcomes: configured key events
Traffic that does nothing is a cost centre, so the outcome layer matters most: enquiries, purchases, signups — whatever the client's GA4 property records as key events, filtered to organic where possible. This is the number the retainer is ultimately judged on.
The caveat is built into the phrase “configured”. GA4 only reports the events someone set up and marked as key events. If the outcome numbers look thin, check the tracking before the strategy — a missing event is a measurement gap, not an SEO failure, and reporting that honestly is how you get it fixed.
Branded vs non-branded, and the queries you cannot see
Branded demand — searches for the client's name — and non-branded demand behave differently and are won differently. Retainer SEO is usually judged on the non-branded side, so segment queries where you can rather than letting a brand campaign's lift inflate the SEO story.
Search Console omits anonymized queries and limits the rows returned. A visible query table is not the full query population or a statistical sample of it. Use the appropriate chart total for the selected scope, and explain why adding visible rows may not reproduce it. Applying query or page filters can also change what is included or how data is aggregated.
Compare like-for-like periods
Choose comparisons suited to the question: calendar months for the reporting cadence, equal-length windows for daily activity, and year-on-year context for seasonality. Note different month lengths and weekdays rather than treating every change in a total as performance. Seasonal effects depend on the business; compare relevant historical patterns before proposing a cause.
Search Console data itself arrives with processing delays and is not a real-time feed, so a report run on the first of the month may be missing the final days. Note the period's actual coverage rather than implying same-day completeness.
A readable layout — and the limits worth stating
Order the report the way the client's questions run: visibility first, visits second, outcomes third, then the supporting detail and your commentary. End every report with what the data means for next month's work — metrics without actions are a weather report.
- Visibility: impressions, clicks, CTR, average position (trend, not rank).
- Visits: organic sessions, engagement, top landing pages.
- Outcomes: key events from organic, noting anything untracked.
- Diagnostics: authority and query detail where they explain movement.
- Caveats: processing delays, anonymized queries, click-vs-session gaps.
ReportingBee composes exactly this layout from connected Search Console, GA4 and Ahrefs sources — with commentary beside every section and the definitions stated plainly. See the structure on the SEO reporting software page, or the review-ready view on the SEO reporting dashboard page.
Sources
Related guides
Put it into practice
ReportingBee turns connected marketing data into branded client reports — refresh the figures, write the commentary, send the link.