In brief
- Define the action first — a “conversion” in Google Ads and a “key event” in GA4 are not automatically the same thing.
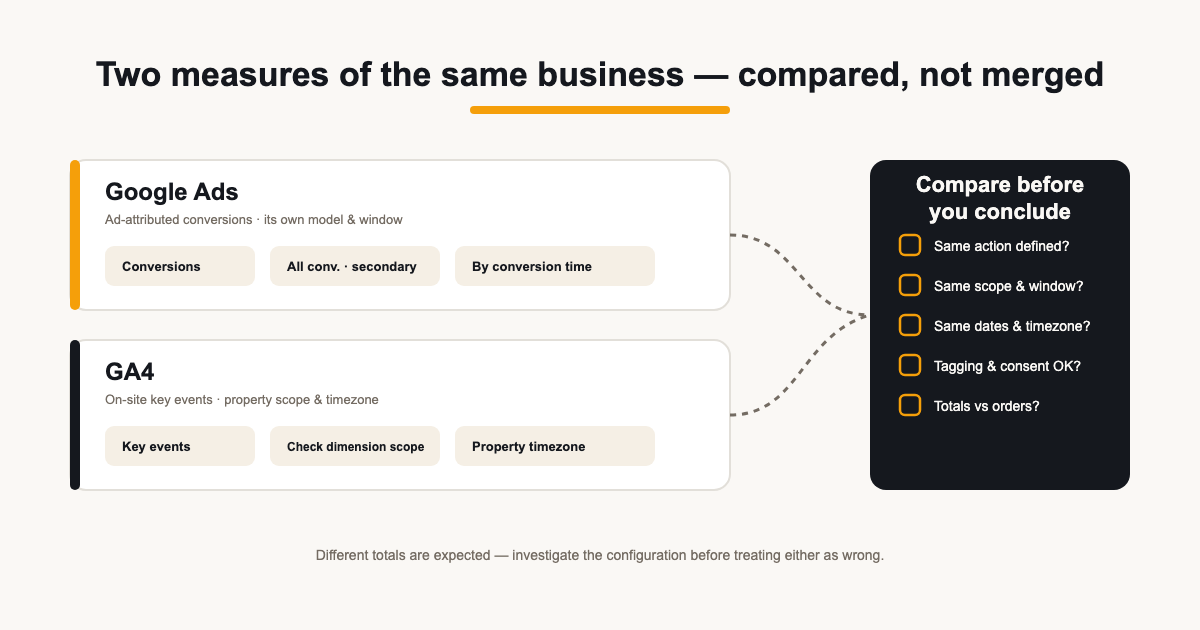
- Check action definitions, counting methods, attribution scope, dates and tagging before deciding what caused the gap.
- Never sum the two systems or average them — reconcile against orders or the CRM instead.
Contents
- Define the action before comparing numbers
- Conversions vs All conversions vs key events
- Interaction date vs conversion time
- Attribution model, window and scope
- Timezones, date boundaries and data maturity
- Consent, tagging and tracking as possible causes
- Reconcile against orders and CRM — not platform credit
- An investigation checklist you can reuse
A familiar PPC review question is why Google Ads and GA4 show different conversion totals for the same month. Before calling either figure wrong, check whether they describe the same action, reporting period and attribution scope.
A discrepancy can reflect different definitions and attribution settings, but it can also reveal a tracking fault. This guide gives you an investigation order: align the measurements first, then test implementation and reconcile the results against a clearly defined business record.
Define the action before comparing numbers
Before any discrepancy means anything, confirm both systems are nominally measuring the same business action. In Google Ads, a conversion is whatever the account's conversion actions define — a purchase, a form submit, a page view if someone configured it that way. In GA4, a key event is whatever the property marks as one.
Comparing Ads “purchases” against GA4 “purchases” only works if both exist, both fire on the same user action, and neither double-counts. Start the investigation in each tool's configuration, not in the report.
Conversions vs All conversions vs key events
Google Ads reports more than one conversion column. “Conversions” generally reflects primary actions included in the selected goals, while “All conversions” also includes secondary actions and additional conversion sources such as view-through conversions. Choosing a broader column changes the comparison; it does not by itself mean either system is overcounting.
Counting methods matter on both sides. Google Ads supports counting one or every conversion after an ad interaction. GA4 key events can be counted once per event or once per session, depending on the configured method. Check each action's setting and when it changed before assuming a tracking fault. GA4 counting-method changes apply going forward, not retroactively to earlier events.
Interaction date vs conversion time
Google Ads can report conversions two ways: against the date of the ad interaction (the click) or against the date the conversion happened (“by conv. time”). A March click that converts in April lands in March under interaction-date reporting and April under conversion-time reporting.
GA4 attributes the event to when it occurred. Comparing Ads by interaction date against GA4 by event date misaligns borderline cases at every month boundary — the same conversion counted in different months by the two tools. Align the date basis before comparing totals.
In practice, pick one convention per report and state it. Reporting Ads conversions by conversion time alongside GA4 key events is the closest like-for-like alignment for a monthly report; the interaction-date view is the right one for judging what a campaign produced from the clicks it bought. Confusing the two is how a single conversion appears to vanish — or double — at month end.
Changing to a conversion-time column aligns the date basis only; it does not make the two systems' attribution models or conversion definitions identical.
Attribution model, window and scope
Record the traffic-source dimension as well as the metric. In GA4, “Session source” describes session acquisition, while event-scoped “Source” or “Medium” attributes credit for key events using the property's reporting attribution model. User- and session-scoped dimensions do not change when that model changes. Google Ads applies its own conversion-action settings and attribution model; data-driven credit may be fractional.
So an organic-search visit that later converted after an ad click, or a user who saw an ad without clicking, will be claimed differently — or solely — by each system. Neither is “last click” by assumption, and neither total is guaranteed to match the other. Report each figure labelled with its model and window rather than treating one as the error.
Timezones, date boundaries and data maturity
Ad accounts and GA4 properties keep their own timezones, so “March” can begin and end at different instants in the two reports — a systematic shift at every period edge. Check the timezone of each account before treating a boundary discrepancy as a trend.
Data maturity matters as well: conversions can be recorded days after the click, and both systems continue processing after the period closes. A report pulled early in the month understates the end of the previous one more than the beginning — another reason totals pulled on different days disagree.
Consent, tagging and tracking as possible causes
After aligning definitions, test the implementation. Consent settings affect which signals can be observed; eligible reports may also include modelled results. Broken or duplicate tags, cross-domain configuration and blocked requests are possible explanations to investigate, not conclusions to assume. Check the chosen reporting identity and consent configuration before attributing a gap to any single cause.
Each of these is checkable: tag coverage in the site's own debug tooling, consent behaviour in the tag setup, and whether the same purchase can fire two events. Confirm or eliminate them one at a time rather than blaming “tracking” generically.
Reconcile against orders and CRM — not platform credit
For purchases or qualified leads, use deduplicated order or CRM records as an operational comparison, with matching dates and status rules. Decide how test orders, cancellations and refunds are handled. Those records answer what the business recorded; platform attribution answers which marketing interactions receive credit, so they are related checks rather than interchangeable totals.
Two rules keep reporting sane. Never sum the platforms: each claims overlapping credit, so adding them double-counts. And never average conflicting counts to split the difference — the truth is not the midpoint of two different definitions. Present each labelled, reconcile to the business record, and state clearly which source each figure came from.
An investigation checklist you can reuse
| Check | Where | What to verify |
|---|---|---|
| Same action | Ads conversion actions vs GA4 key events | Both fire on the same user action; no duplicates |
| Column & count mode | Ads conversion settings and GA4 key-event settings | Selected columns; Ads one/every and GA4 per-event/per-session methods |
| Date basis | Ads reporting options | Interaction date vs by conv. time |
| Model & window | Ads action settings and GA4 report dimensions/settings | Dimension scope, attribution model and window |
| Timezone & maturity | Account and property settings | Same period boundaries; data fully processed |
| Tagging & consent | Site tag setup | Tags firing once; consent behaviour understood |
| Baseline | Store orders / CRM | Both systems reconciled to the business record |
Explaining it to a client, a template that works: “The two systems measure differently — Ads credits the ad interaction on its own model and window, GA4 counts events on site. This month they show X and Y against Z actual orders. We report both labelled, and we watch the order total as the baseline.”
ReportingBee keeps the two sources in separate labelled widgets in the same report — see the Google Ads reporting page for the paid side, and analytics reporting for how GA4 figures are presented with their configuration caveats.
Sources
Related guides
Put it into practice
ReportingBee turns connected marketing data into branded client reports — refresh the figures, write the commentary, send the link.