Dashboards
A marketing dashboard for people who own channels
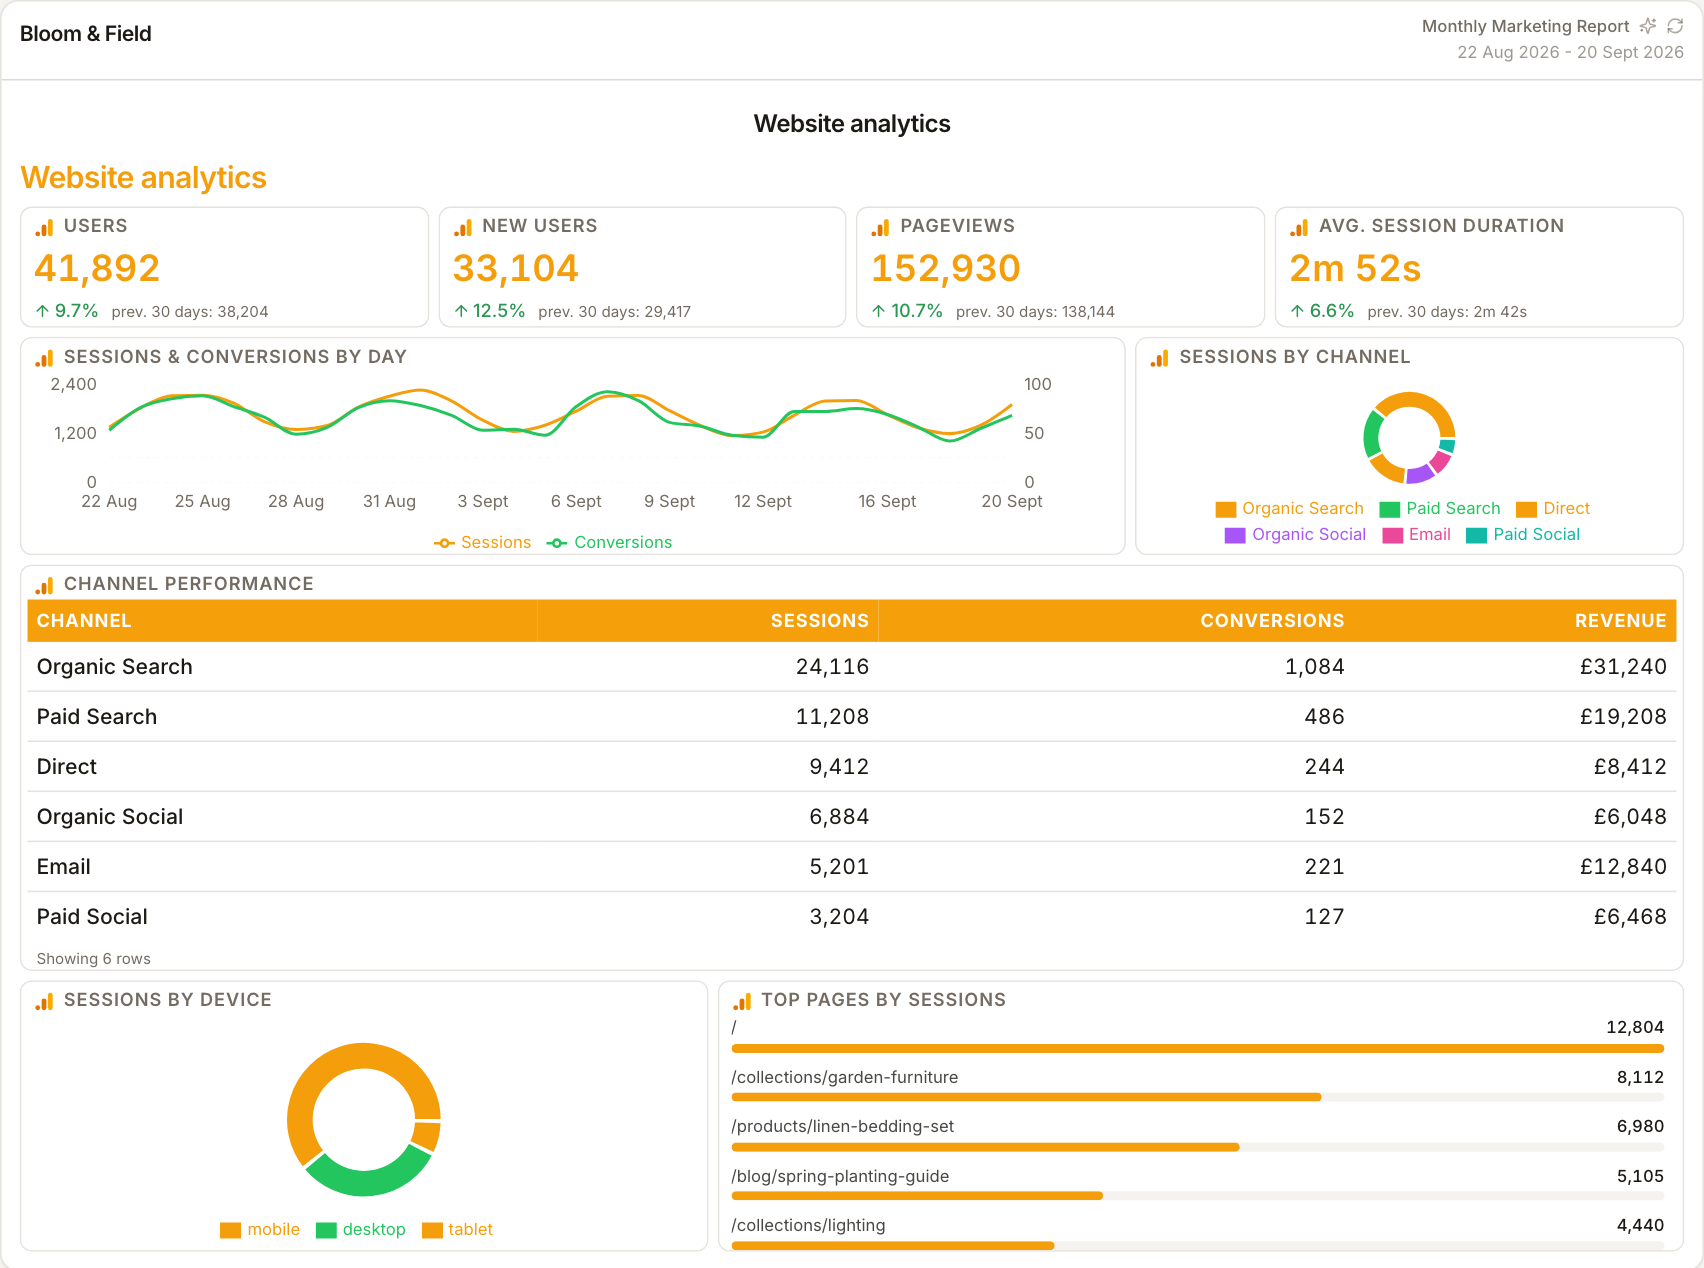
Sessions, spend, conversions and rates across every channel on one screen — a working overview for channel owners, not a vanity wall.
From £9.99/month · Agency £49/month
What you can report on
- Sessions by channel
- GA4 traffic split across organic, paid, social and referral — the shared unit every channel owner can be compared on.
- Conversion rate
- Conversions per session — only meaningful when numerator and denominator come from the same source, which the dashboard keeps paired.
- Spend total
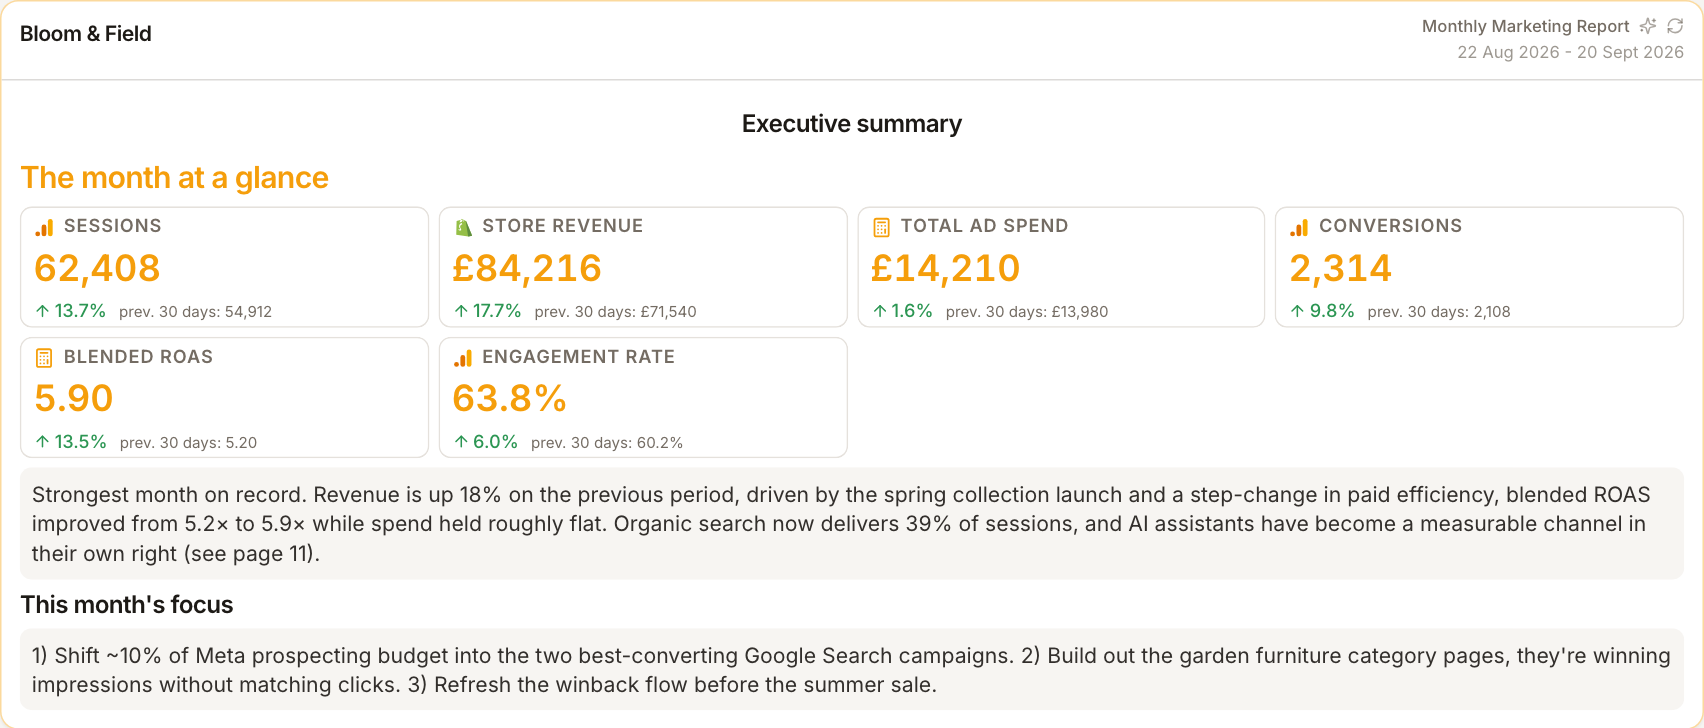
- Combined ad spend beside combined results — directional, with per-platform figures retained underneath.
The channel owner's morning screen
Channel managers need a scan, not a report: is anything on fire, is anything quietly winning? A marketing dashboard puts each channel's headline numbers in comparable widgets so anomalies surface in seconds and deserve a deeper dive in the source tool.
Rates need matched denominators
Dividing Meta-reported conversions by GA4 sessions produces a misleading number. The dashboard discipline: pair each rate's numerator and denominator from the same source — GA4 conversion rate from GA4, platform cost per result from the platform — and label accordingly.
From dashboard to report
Dashboards and reports are separate views built from the same connected sources. Keep the periods and metric definitions consistent between them and refresh each before sharing — a different refresh or date range can produce different figures.
How it works
01
Connect the client's stack
Link analytics and ad sources; plan manual widgets for anything without live coverage.
02
Build the overview
Channel-comparable headline widgets across the top, per-channel detail below.
03
Scan, then report
Use the dashboard for internal triage; let it feed the client report when the month closes.
Simple, capped pricing
£9.99/month starter
First client included, then £3.99/month per extra client, capped at ten slots (£45.90/month).
£49/month agency
Flat monthly price with unlimited clients.
Frequently asked questions
How is this different from a client report?
The dashboard is your working overview — scanned frequently, no commentary. The report is the branded deliverable built from the same data with narrative added.
Can I mix metrics from different sources?
Yes side by side — just don't combine them into rates across sources. Each figure stays labelled by where it came from.
How much does ReportingBee cost?
Starter is £9.99/month for your first client and £3.99/month for each extra client, capped at ten client slots (£45.90/month). The Agency plan is £49/month flat with unlimited clients.
Keep exploring
Marketing Reporting Software
Search, ads, social and email in one report — each channel's figures labelled by source, with commentary that explains the mix instead of summing it.
Client Reporting Dashboard
Each client's key metrics, shared report links and portal access in one controlled view — they see a curated overview, you keep the working detail.
Analytics Reporting
Traffic, engagement and conversions from GA4 composed into a readable report — your clients get the story, you keep the analysis.
Browse all reporting guides
Reporting
- Client Reporting Software
- Agency Reporting Software
- Marketing Reporting Software
- Digital Marketing Reporting
- SEO Reporting Software
- SEO Reporting for Agencies
- PPC Reporting Software
- White Label Reporting Software
- Automated Reporting
- Automated Client Reporting
- Ecommerce Reporting
- Analytics Reporting
- KPI Reporting
- Social Media Reporting
- Social Media Reporting Software
- Ahrefs Reporting
- Google Analytics Reporting
- Google Search Console Reporting
- Google Ads Reporting
- Facebook Ads Reporting
- Instagram Reporting
- LinkedIn Reporting
- Mailchimp Reporting
- Facebook Ads Reporting Tool
- Google Ads Reporting Tool
- SEO Client Reporting
- Marketing Agency Reporting
- Digital Agency Reporting
Dashboards
Your first branded report is minutes away
Add a client, connect their data and share a live report today.