In brief
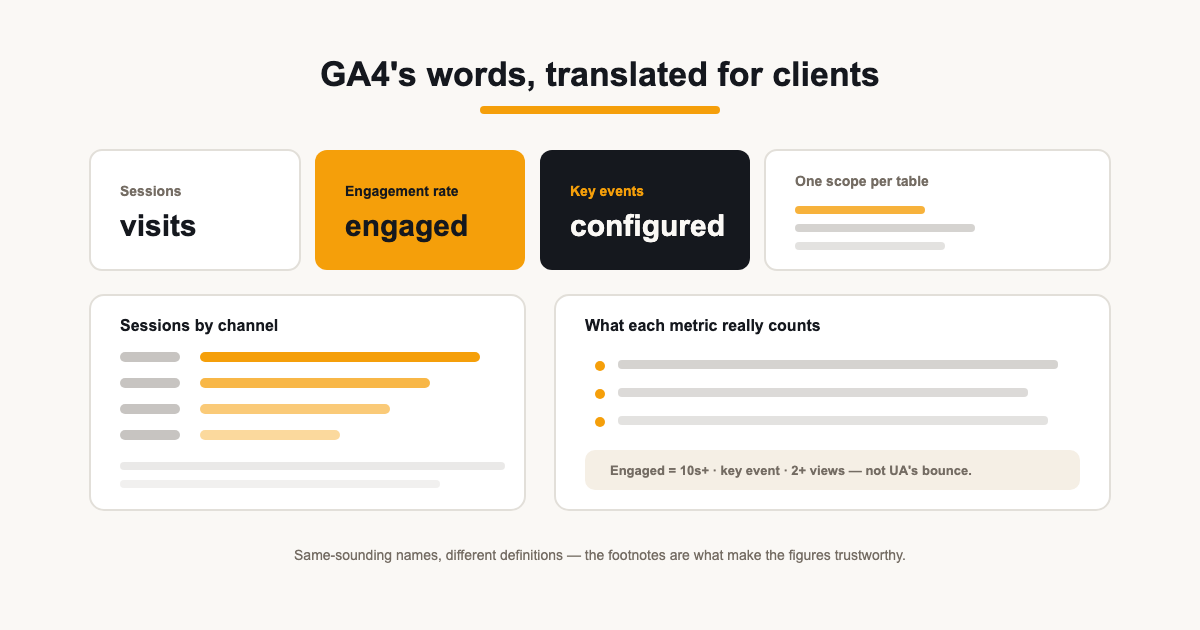
- GA4's engagement rate replaced bounce rate — a session is 'engaged' by duration, conversion or pageviews, not by interaction count.
- Key events are configured outcomes, not automatic ones — the report should say which actions count.
- Session-scoped and event-scoped attribution answer different questions; mixing them in one table manufactures discrepancies.
Contents
- GA4 counts events, not hits — and that changes the words
- Sessions, users and the difference that matters
- Engagement rate: bounce rate, inverted and stricter
- Key events: configured outcomes, not automatic ones
- Attribution scope: the quiet discrepancy-maker
- The tables worth the space: channels and landing pages
- The limits worth a footnote
- A GA4 section that reads top-down
GA4 reports what clients ask about most — how many people came, what they did, whether they converted — but its metric names are deceptively familiar. 'Users', 'sessions' and 'bounce' all exist, and none means quite what it meant in Universal Analytics. Reporting GA4 figures with UA assumptions produces numbers that are technically right and practically misleading.
This guide covers the GA4 metrics worth putting in a client report, what each genuinely counts in the event-based model, and the platform limits — thresholding, modelling, consent gaps — worth a footnote.
GA4 counts events, not hits — and that changes the words
Universal Analytics organised data around hit types — pageviews, events, transactions as distinct things. GA4 flattened everything into events: a pageview is an event, a scroll is an event, a purchase is an event. That unified model is why the familiar metrics needed redefining — 'session' is now a grouping of events within a timeout, not a distinct hit type.
The reporting consequence: figures that look comparable to old UA numbers often aren't. Sessions are counted differently, users default to a different measure, and bounce rate was inverted into engagement rate. Say 'GA4' once in the report's intro and the footnotes can carry the rest.
Sessions, users and the difference that matters
Sessions count visits: one session is a run of activity with gaps under 30 minutes. Users count people — or more precisely, the identifiers GA4 resolved into a person this period. GA4's headline 'users' is Active users (engaged or new), not Total users, so a GA4 'users' figure reads leaner than the UA equivalent clients remember.
For client reports, sessions are usually the better headline — they measure opportunity (visits to convert in) rather than identity resolution. Users belongs beside it as reach, with the comparison period doing the talking in both cases.
New vs returning users earns a mention when the mix shifts — a campaign that pulls first-time visitors changes the composition even when totals hold. Report the split when it explains something; a standing new/returning table on a stable site is decoration.
Engagement rate: bounce rate, inverted and stricter
A GA4 session is 'engaged' if it lasted over 10 seconds, included a key event, or had two or more page/screen views. Engagement rate is the share of sessions meeting any of those bars — and bounce rate is now just its inverse. This is not UA's bounce rate wearing a new label: UA bounced on single-hit sessions; GA4 counts a 15-second single-page read as engaged.
Key events: configured outcomes, not automatic ones
Key events are events someone marked as important — purchases, form submissions, sign-ups, calls. GA4 does not decide what's a conversion; the property's configuration does. A report's 'conversions' figure is therefore the sum of whichever events were flagged, and two properties can report wildly different 'key event rates' for identical traffic.
Which is why the report should name them. 'Key events: purchases + form submits' is an honest figure; a bare 'Conversions: 312' invites the question 'of what?' — and the answer is the account's config, not the tool's default. This is also half of why Ads and GA4 conversion columns disagree; the definitions guide is linked at the end.
Attribution scope: the quiet discrepancy-maker
GA4 answers 'where did this come from' at three scopes, and they don't agree with each other: user-scoped (the first thing that ever brought this person), session-scoped (what brought this visit) and event-scoped (what gets credit for this conversion). A channel table built on session source and a conversion table built on event source will tell different stories about the same month — both true, differently scoped.
Pick one scope per table and label it. 'Sessions by channel' and 'key events by attributed source' can sit in the same report; mixing scopes inside one table manufactures the discrepancies clients then spend the review meeting on.
The tables worth the space: channels and landing pages
Session default channel group is the traffic summary clients actually use — organic, paid, direct, referral, email, each with sessions, engagement and key events. Landing pages is the other workhorse: which pages earned the visits, and which earned the engaged ones. Together they answer 'where from' and 'where to' without a bespoke exploration.
Device category earns a mention rather than a section — a mobile/desktop split matters when it shifts materially, not as a standing table. Keep the space for breakdowns that change what the client does next.
One caution on channel tables: GA4's grouping is rule-based, and 'Unassigned' is where traffic lands when UTM tagging is sloppy or absent. A rising Unassigned row is a tagging problem to fix, not a channel to explain — worth its own line of commentary when it appears.
The limits worth a footnote
- Consent gaps: declined cookies mean unmeasured sessions — GA4 models some of it, and modelled data blends into totals.
- Thresholding: small rows can be withheld when Google signals are on, so long-tail tables can undercount.
- Processing delay: recent days can restate; reports exclude today, and yesterday can still settle.
- Filters and internal traffic: what the property excludes never reaches the report at all.
None of these make GA4 unusable for reporting — they make the honest version of it: figures from a defined period, on stated definitions, with known gaps. That footnote is the difference between data a client trusts and data they learn to question — a figure with a stated limit is evidence; an unexplained one is an invitation to argue about the tool instead of the result.
A GA4 section that reads top-down
Headline row: sessions, engaged sessions or engagement rate, key events — the verdict. Middle: the trend chart and channel table (one scope, labelled). Bottom: top landing pages. The pattern matches the wider report — outcome, evidence, detail — and leaves exploration-grade slicing inside GA4 where it belongs.
ReportingBee pulls this section straight from the connected GA4 property — headline metrics, channel split, device mix, top pages — into the client's branded report. See the coverage on analytics reporting, or the connection specifics on the GA4 integration guide.
Sources
Related guides
Put it into practice
ReportingBee turns connected marketing data into branded client reports — refresh the figures, write the commentary, send the link.