In brief
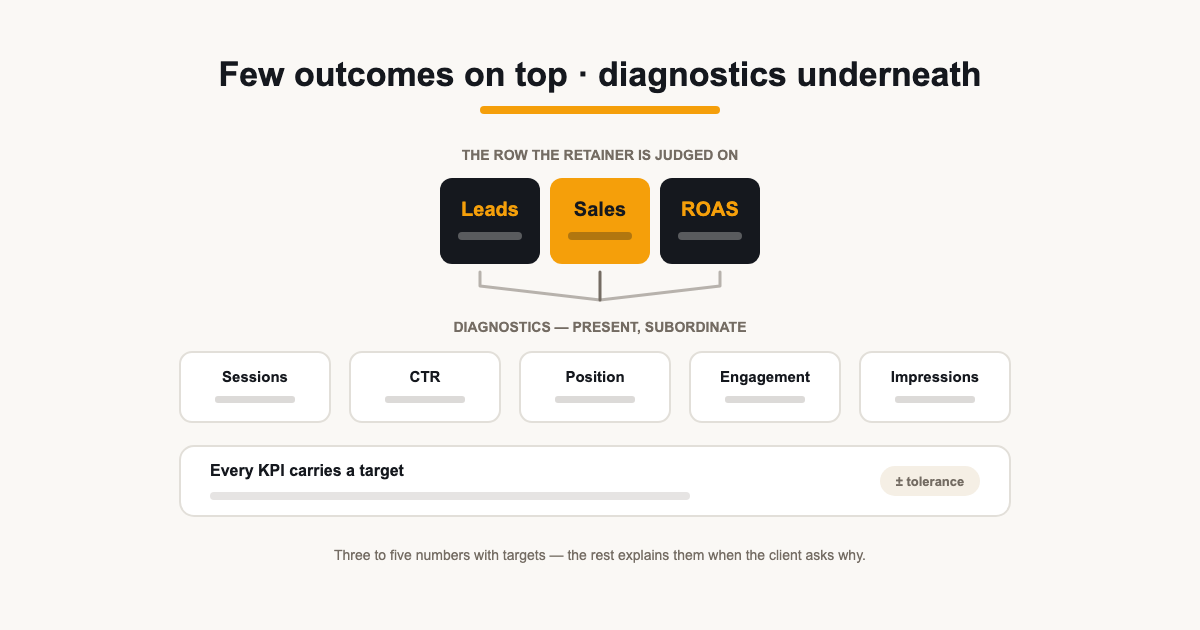
- A KPI is what the retainer is judged on — usually three to five outcomes, not a page of charts.
- Diagnostics belong nested under the outcome they explain, never in the headline row.
- Changing a KPI mid-engagement means restating the baseline, not swapping the widget.
Contents
Every metric you can report is available in a tool somewhere, which is exactly why KPI selection goes wrong — the report fills up with numbers that are easy to get rather than numbers the client is paying to move. A KPI is the small set the retainer is actually judged on; everything else is supporting evidence.
This guide covers how to choose that set: outcomes before activity, targets attached to every number, a different selection per business model, and how to change KPIs mid-engagement without quietly rewriting history.
A KPI is a commitment, not a chart
The distinction that matters: a metric is anything measurable; a KPI is a metric you have agreed to be held accountable for. Putting a number in the KPI row is a promise — it says this figure, moved in the right direction, is what the engagement is for.
That is why the set stays small. Three to five KPIs is a contract; twenty is a data dump that lets every bad month hide behind a good chart. If everything is key, nothing is.
The practical test for membership of the KPI row: would you call the client if this number broke badly? Leads halving — yes, that is a phone call. Average position slipping two places — that is a paragraph in the SEO section, not a headline. If the honest answer is 'I'd want to know but I wouldn't act', the metric is a diagnostic.
Outcomes first, diagnostics underneath
Outcome metrics are the ones a client's business feels: leads, sales, revenue, signups, qualified calls. Diagnostic metrics explain why outcomes moved — sessions, CTR, impressions, engagement rate, average position. Both belong in a report, but they do different jobs and belong on different rows.
The test from the monthly-report guide applies here too: if a metric improved but no outcome changed, would you lead with it? If not, it is a diagnostic — it sits under the outcome it supports, ready when the client asks why.
The layering matters in both directions. Diagnostics promoted to headlines produce reports full of activity and thin on outcomes — busy months that explain nothing. And diagnostics dropped entirely produce verdicts with no evidence — 'leads are down' with no visible 'because'. The KPI row answers what happened; the diagnostic layer underneath answers the follow-up before it's asked.
Every KPI needs a target and a tolerance
A number without a target is a weather report: it tells you the temperature, not whether to act. For each KPI, agree the target and the tolerance — the level you're aiming for and the band that counts as normal variation around it.
Tolerance is what stops the report becoming noise. A 4% dip inside the agreed band is context, not a crisis; a 30% drop outside it is a section in the report with a plan attached. Agreeing the band up front means the bad-month conversation is about the response, not about whether the month was even bad.
Set targets from baselines, not wishes. The honest starting point is the trailing average over the last quarter or year — then the target is a negotiated step from there, not a number plucked from a pitch deck. A target the data says is reachable gets defended; an aspirational one gets quietly ignored, which is worse than no target at all.
The right set depends on the business model
| Client type | Headline KPIs | Diagnostics that explain them |
|---|---|---|
| Lead generation | Qualified leads, cost per lead, lead-to-sale rate | Form fills, calls, CTR, landing-page sessions |
| Ecommerce | Revenue, orders, ROAS, AOV | Sessions, conversion rate, channel revenue mix |
| SaaS / subscription | Signups, trials started, activation | Demo requests, signup-page traffic, source mix |
| Local services | Calls, direction requests, bookings | Business-profile actions, local rankings, site calls |
Use the table as a starting position, then cut anything the client cannot act on. A KPI the client reads but cannot influence is a diagnostic wearing the wrong badge.
Change the set without rewriting history
KPIs legitimately change — the client pivots, the retainer scope moves, a metric turns out to be unmeasurable cleanly. What they should never do is change silently. Swapping a KPI widget between sends rewrites the report's history and teaches the client to distrust trend lines.
The honest way: announce the change in the report, restate the baseline for the new KPI from the same period, and keep the old one visible for one more cycle. It is the measurement equivalent of a footnote — cheap to write, expensive to skip.
Review the set quarterly, not just the numbers
The monthly report reviews performance against the KPIs; a quarterly check reviews the KPIs themselves. Are these still the numbers the engagement is judged on? Has the client's business moved? Has a diagnostic quietly become the thing they actually care about?
This is also where vanity metrics die. If a KPI has sat unchanged and uncommented for a quarter — never targeted, never acted on — it is decoration, and the report is better without it.
Watch for KPI drift in the other direction too: a diagnostic the client keeps asking about is quietly campaigning for promotion. If 'cost per lead' gets pulled into every review conversation, it has earned the headline row — promote it deliberately at the quarterly review rather than letting it squat informally in the discussion.
What it looks like in the report
The KPI row leads the report: each outcome with its value, its target, the period comparison and a state — on track, behind, at risk. Diagnostics follow inside each channel section, present but subordinate. The reader gets the verdict first and the evidence on demand.
The same set should drive the goals and alerts surface — a KPI that only exists inside the monthly document gets noticed twelve times a year. Tracked continuously, the same number is the early-warning system: the report then narrates what the tracking already saw, rather than breaking news a month late.
ReportingBee has a dedicated surface for exactly this: KPI goals per client with targets and status, feeding the same numbers into the report's KPI section. See the mechanics on KPI reporting, and how it sits inside the deliverable on client reporting software.
Sources
Related guides
Put it into practice
ReportingBee turns connected marketing data into branded client reports — refresh the figures, write the commentary, send the link.