In brief
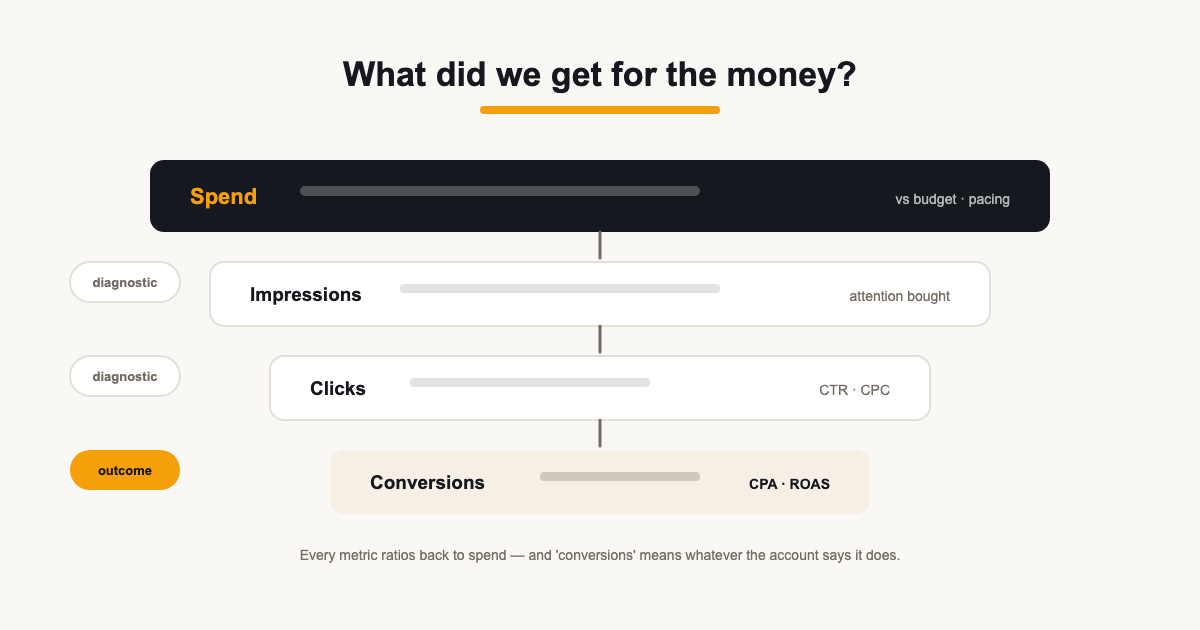
- Spend is the anchor — every other PPC metric is a ratio against it or a diagnostic for it.
- 'Conversions' means whatever the account's conversion actions say, counted its way — check the config before the number.
- ROAS is only as honest as the revenue tracking behind it; say which system's revenue it uses.
Contents
- Start from 'what did we get for the money'
- Spend and impressions: the money in
- CTR and CPC: the efficiency diagnostics
- Conversions: check the configuration before the number
- CPA and ROAS: the outcome ratios
- The diagnostic layer: search terms, campaigns, devices
- Compare periods like-for-like
- A PPC report layout that reads in order
PPC reports answer one question: what did we get for the money? The metrics that answer it are few — spend, CPC, conversions, CPA, ROAS — but each carries a definition that bends depending on the account's configuration, and most client confusion comes from figures that are technically right and contextually wrong.
This guide walks the funnel top to bottom: what each metric genuinely measures, the configuration details that change its meaning, and how to explain the numbers without either overselling them or drowning the client in caveats.
Start from 'what did we get for the money'
Every PPC report is a purchase justification. The client spends money on clicks; the report's job is to show what those clicks produced — and where the chain between spend and outcome is weak. Structure the metrics in funnel order: money in, attention bought, action produced, value returned.
That ordering also tells you where to look when results disappoint. Weak outcomes with strong spend point at the click→conversion stages; weak spend with strong efficiency points at budget, not performance — different problems, different conversations.
Spend and impressions: the money in
Cost (spend) is the anchor everything else ratios against. Report it per channel and in total, against the period's budget if there is one — pacing matters as much as the total. A month that spent 60% of budget and hit targets is a different story from one that overspent to reach the same number.
Impressions and reach sit underneath as diagnostics: they answer whether the budget even bought attention. Impression share, where the account exposes it, goes a step further — it says how much of the available attention the budget captured, which is the cleanest 'should we spend more?' signal paid search offers.
CTR and CPC: the efficiency diagnostics
Click-through rate (clicks ÷ impressions) and cost per click (spend ÷ clicks) measure the middle of the funnel: is the ad compelling, and what does the platform charge for it? CTR rises with relevance and creative; CPC rises with competition and bid pressure — and the two often move together in ways that need reading together.
Conversions: check the configuration before the number
'Conversions' in Google Ads means whatever the account's conversion actions define — purchases, leads, page views if someone configured it that way — counted by each action's own rules. A conversion column can include primary actions only or every action; counting can be one-per-click or every occurrence. The same traffic produces different totals under different settings.
This is also why Ads and GA4 conversion figures differ structurally — different definitions, different attribution, different date bases. That gap deserves its own explanation (we wrote a full investigation guide, linked at the end); in the report itself, label each conversion figure with its source so a discrepancy reads as a definitions question, not an error.
Attribution windows bend the number further. A 30-day click window and a 7-day click window report different conversion totals for identical traffic — conversions keep arriving after the click for weeks. When the report compares this month to last, both figures carry their windows; a mid-period window change is a methodology change, and it belongs in the footnotes.
CPA and ROAS: the outcome ratios
Cost per acquisition (spend ÷ conversions) is the lead-gen bottom line: what each conversion cost. Return on ad spend (revenue ÷ spend) is the ecommerce equivalent: what each pound bought back. Both are only as trustworthy as their inputs — CPA inherits whatever 'conversion' means in that account; ROAS inherits the revenue value tracking, which may come from the ad platform's tag, GA4 import, or the store itself.
State which revenue the ROAS uses. A 4.0 ROAS from the platform's own conversion value and a 4.0 from Shopify orders can describe different months. And resist quoting ROAS for lead-gen clients — without revenue values the number is invented; CPA is the honest metric there.
For multi-channel accounts there is a blended cousin worth knowing: total revenue ÷ total ad spend across all platforms (sometimes called MER, marketing efficiency ratio). It sidesteps per-platform attribution arguments — instead of debating which platform 'gets' the sale, it measures whether the whole paid budget is pulling its weight. Per-platform ROAS still earns its place for budget allocation; blended is the honest number for the board question.
The diagnostic layer: search terms, campaigns, devices
Below the funnel metrics sits the detail that explains movement: which campaigns drove the spend, which search terms triggered the clicks, which devices converted. This layer isn't for the headline row — it's for the 'why' when a number moves, and for the work-completed section that shows what you're managing.
Keep it selective. A top-spend-campaigns table and a shortlist of notable search terms carry the story; a full keyword dump is the ad account exported, not reported.
This is also where negative-keyword work shows up — pruning wasted queries is invisible in the headline numbers but legible here. A line naming what you excluded earns its place: it shows the budget actively defended, not just spent.
Compare periods like-for-like
Month-on-month PPC comparisons carry a specific trap: months differ in length and weekday mix, and paid spend follows business days. A 31-day month 'outperforming' a 28-day one can be pure calendar. Equal-length windows or daily-rate comparisons keep the comparison honest; seasonal businesses want year-on-year context instead.
Promotions, sales events and budget changes mid-period deserve annotations in the report — a spike explained beats a spike that invites the wrong question at the review.
A PPC report layout that reads in order
- Headline: spend vs budget, conversions, CPA or ROAS — the verdict row.
- Efficiency: CTR and CPC trends per channel.
- Channel split: each platform's figures labelled by source.
- Diagnostics: top campaigns, notable search terms, device mix.
- Work and next steps: what was managed, what changes next period.
ReportingBee composes this layout from the connected ad accounts — Google, Meta, Microsoft and more in the same branded report, each figure labelled with its platform. See the structure on PPC reporting software, or the channel-specific view on Google Ads reporting.
Sources
Related guides
Put it into practice
ReportingBee turns connected marketing data into branded client reports — refresh the figures, write the commentary, send the link.