In brief
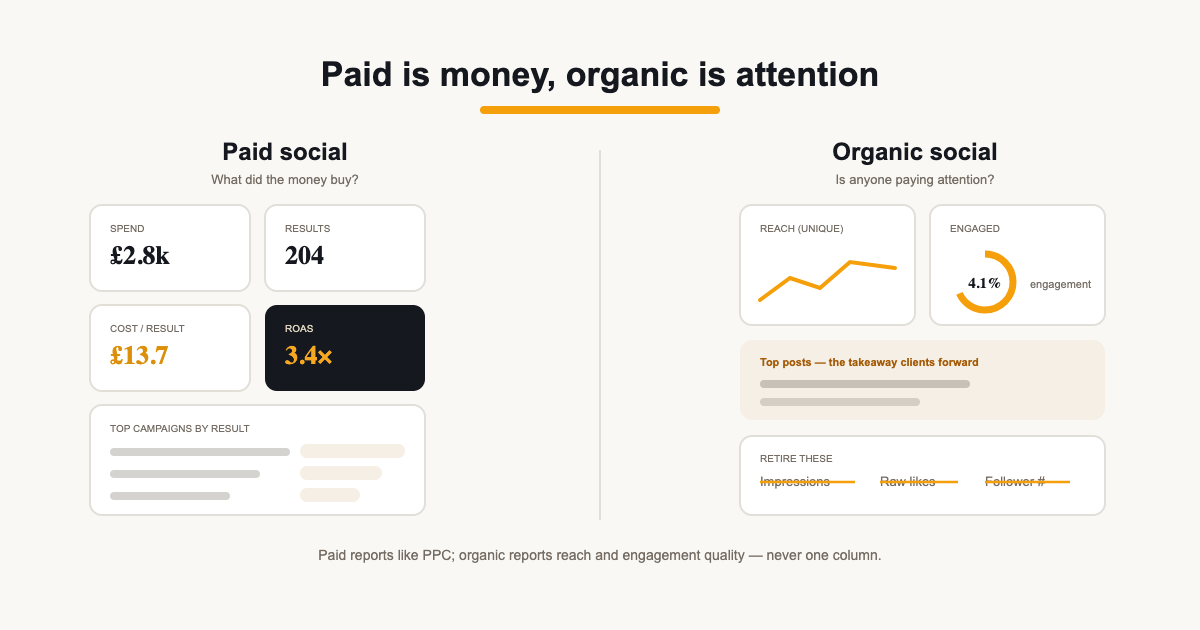
- Split paid from organic first — paid answers 'what did the money buy', organic answers 'is anyone paying attention'.
- Paid social reports on spend, results and efficiency — the same grammar as PPC.
- Organic reports on reach and engagement quality; raw impressions and follower counts are context, not results.
Contents
Social reporting has a vanity problem: the metrics that are easiest to produce — impressions, follower counts, likes — are the hardest to connect to anything the client is paying for. Meanwhile the numbers that matter split cleanly in two: paid social is a money question, organic social is an attention question, and muddling them is what produces reports full of big numbers nobody acts on.
Report the two separately, on different skeletons, and the report starts answering the questions a client actually has.
Split paid from organic first
The most common reporting mistake in social is summing paid and organic reach into one 'reach' number. It makes a boosted post look like organic traction and an organic flop look like reach. Paid social is advertising: it buys outcomes. Organic social is publishing: it earns attention. They are different disciplines with different success criteria, and the report should look like it — a client comparing a summed 'reach' against last month's is comparing two different things wearing the same label.
Metrics to retire
Impressions without a denominator, likes without a rate, and follower count without a growth trend all survive on volume — they are big numbers that look like performance. If a metric cannot answer 'so is this good?', it is context for a commentary line at most. The report gets shorter, and shorter is the point: a client who finishes the social section in two minutes and understood all of it will read it next month too. A client who skims a wall of impressive-looking numbers learns the section is decorative — and decorative sections teach readers to skip the report entirely.
Keep one sanity rule: a metric earns a headline slot when the client can state what would make it change their next decision. Reach that decides next quarter's organic budget stays; a lifetime impressions total that answers nothing does not.
Match metrics to the client's actual goal
An awareness client and a lead-gen client need different headline numbers. Awareness: reach, engaged users, follower growth trend. Lead gen: results, cost per result, conversion rate from the landing page — which means the social section should end where the GA4 section begins, since a lead is only real once the site counts it. Choose the headline metric with the client once, write it into the report structure, and stop negotiating it every month.
- Awareness → reach, engagement rate, follower trend.
- Traffic → link clicks, landing-page views, engaged sessions in GA4.
- Leads or sales → results, cost per result, ROAS.
The boosted-post grey area
Boosted posts are where paid and organic blur: the post earns organic engagement while the boost spend earns reach. Report the spend in the paid column — money moved is paid, whatever it bought — and let the organic engagement show in the organic board. If a client asks why a boosted post 'did so well', the answer lives in the split: paid reach, plus whatever organic lift the spend generated. Not separating the two is how paid performance quietly inflates organic results.
Sources
Related guides
Put it into practice
ReportingBee turns connected marketing data into branded client reports — refresh the figures, write the commentary, send the link.
Social's cadence is not PPC's
PPC numbers move daily; social rewards a slower look. Organic trends need a month to mean anything — a week of organic reach is weather, a quarter is climate. Keep the monthly report as the unit of record, put paid pacing in a weekly check if the spend justifies it, and resist turning every platform's native analytics page into a report page. The discipline that makes PPC reports read well — money first, detail earns its place — applies twice as hard here, because the vanity metrics are louder.