Dashboards
An ecommerce dashboard where store meets acquisition
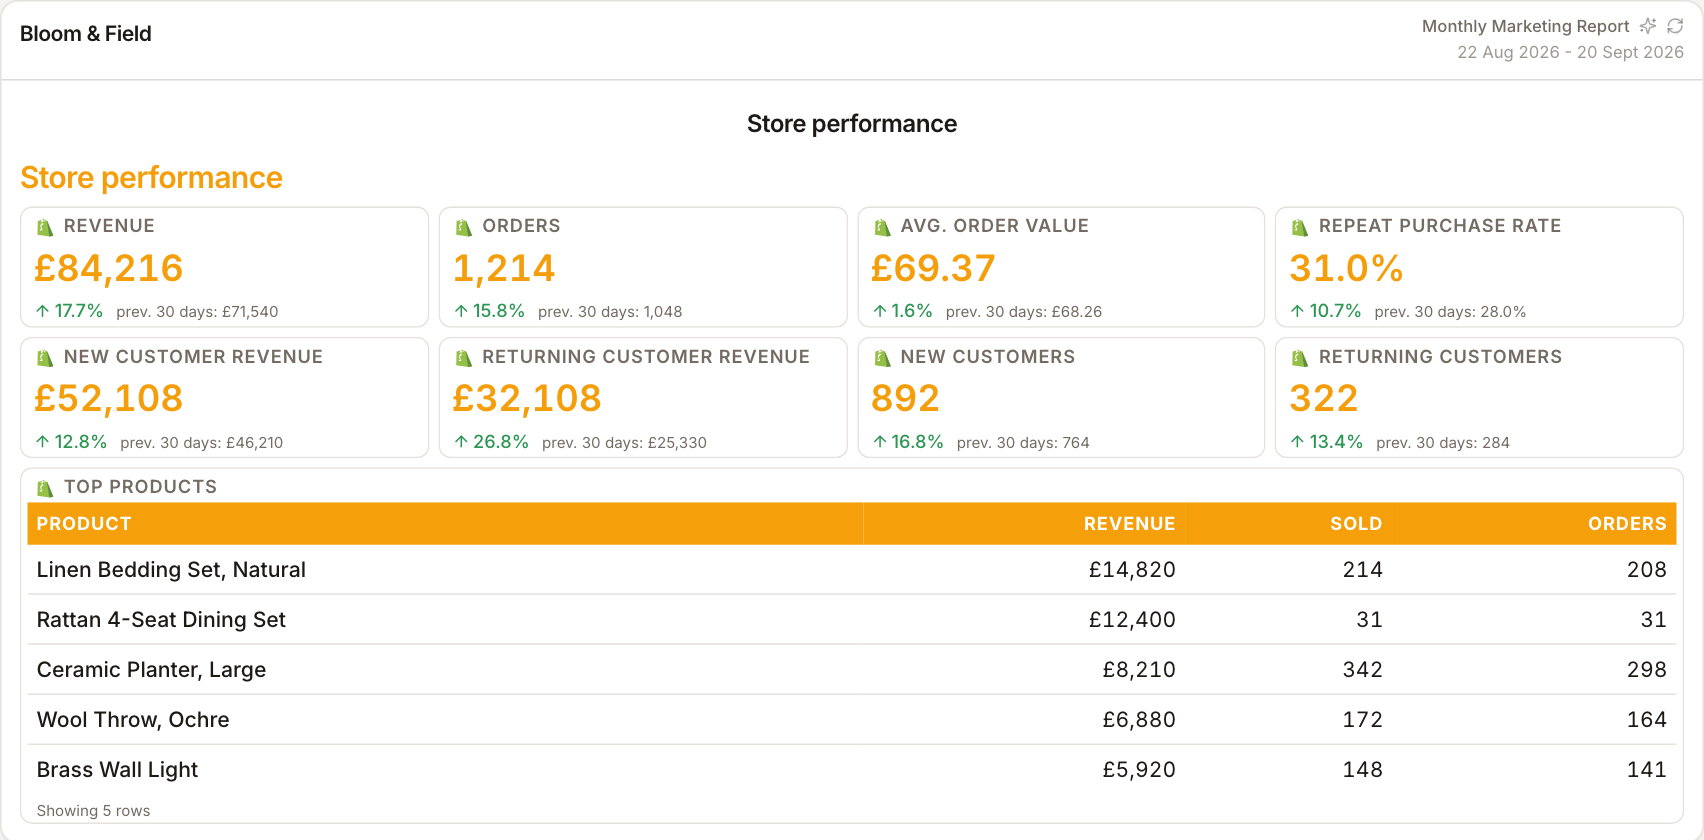
Shopify orders and revenue beside traffic and ad spend — one dashboard, consistent currency and period, so the funnel reads as one story.
From £9.99/month · Agency £49/month
What you can report on
- Revenue & orders
- Shopify's store activity — the dashboard's top line.
- AOV trend
- Average order value across the period — basket size moving with or against traffic.
- Acquisition metrics
- Sessions and ad spend feeding the store figures — the input side of the same view.
One screen, whole funnel
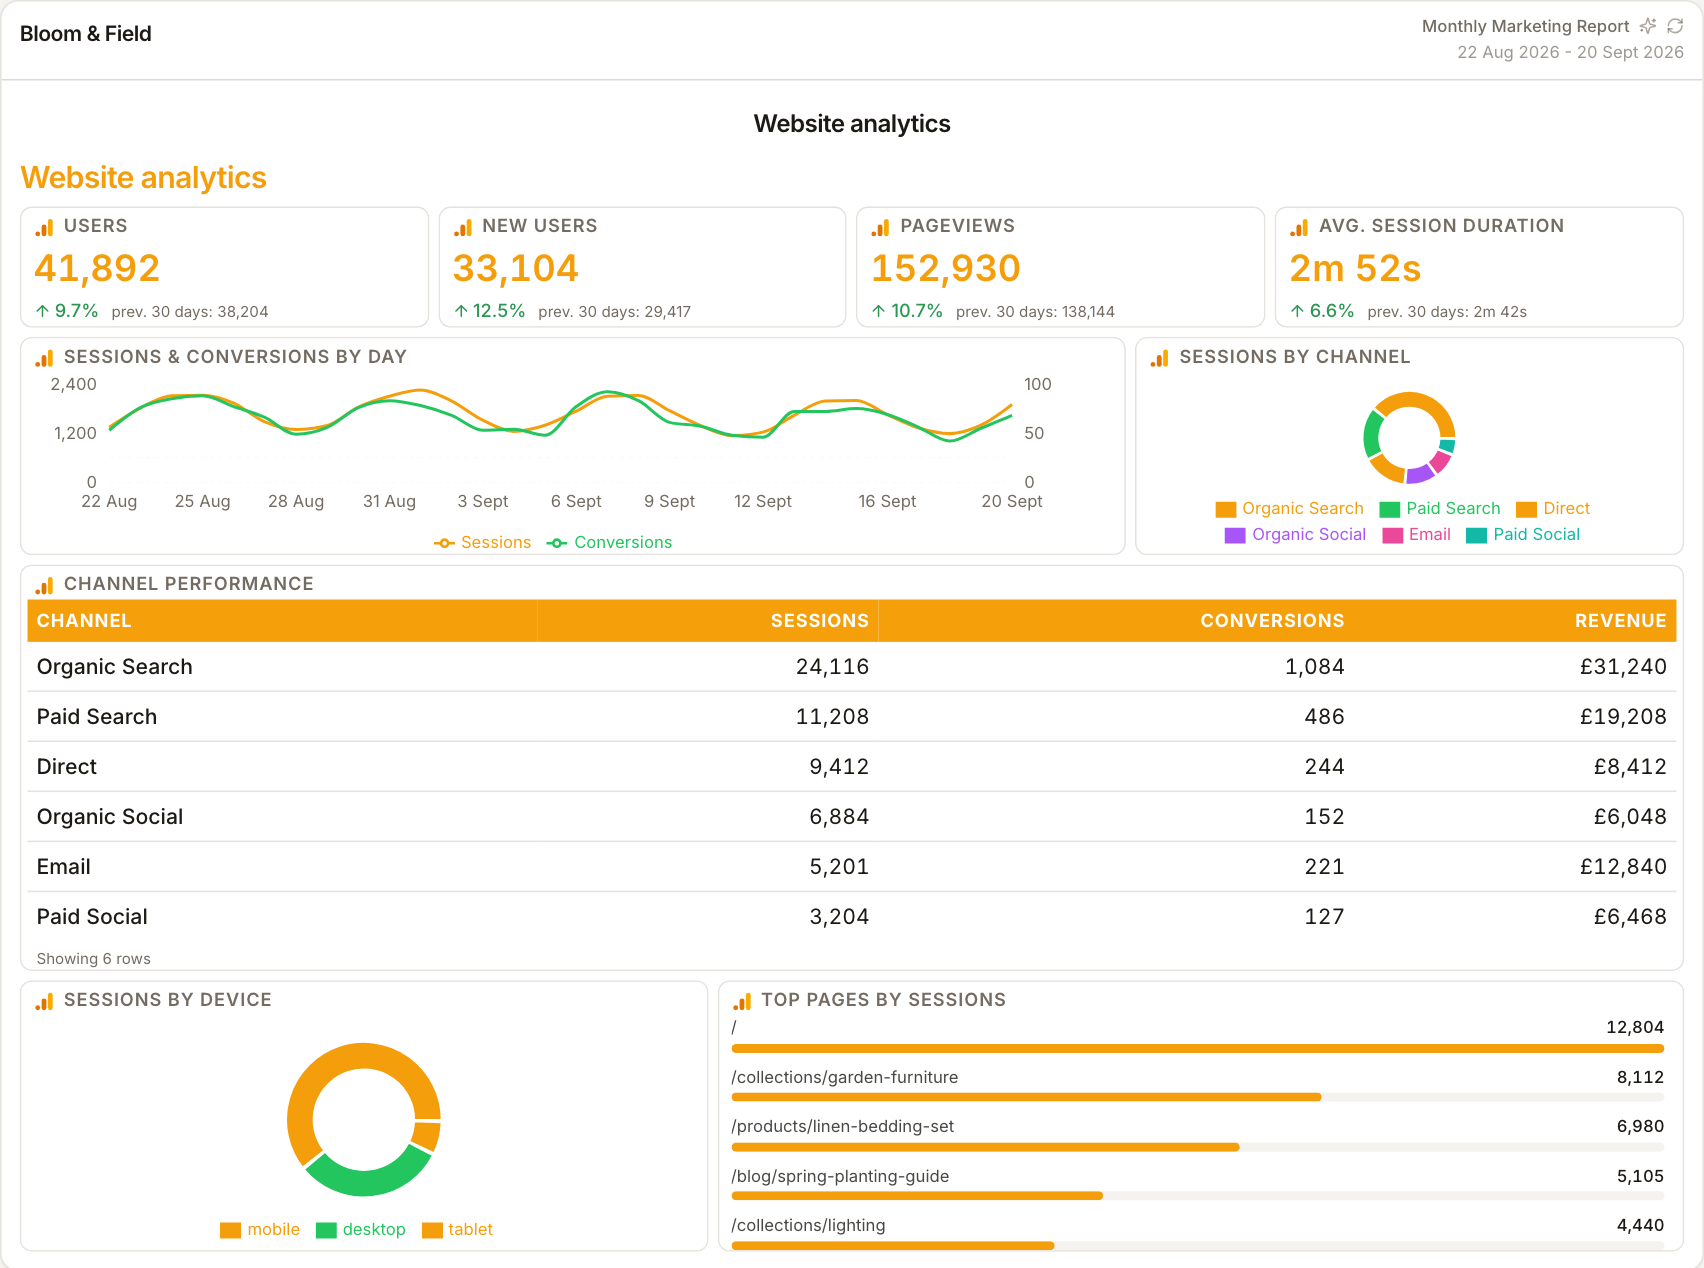
Store numbers in Shopify, traffic in GA4, spend in ad platforms — the ecommerce operator's three-tab problem. A single dashboard puts revenue next to the sessions and spend that generated it, so 'is acquisition paying?' is a glance, not a spreadsheet.
Currency and period discipline
Choose matching reporting periods and check each source's currency before comparing revenue with ad spend. A currency symbol changes presentation, not exchange rates: don't combine differently denominated amounts without a documented conversion outside the report.
From monitor to report
Use the same sources, date ranges and metric definitions in the dashboard and the monthly ecommerce report. They are separate views, so refresh each before sharing — the dashboard's anomalies become the report's commentary.
How it works
01
Connect store and channels
Shopify plus GA4 and ad accounts.
02
Align currency and period
One period, one currency across every widget.
03
Watch the funnel
Revenue beside spend beside sessions — the ecommerce glance.
Simple, capped pricing
£9.99/month starter
First client included, then £3.99/month per extra client, capped at ten slots (£45.90/month).
£49/month agency
Flat monthly price with unlimited clients.
Frequently asked questions
Do store and ad revenue match?
Rarely exactly — attribution differs. The dashboard keeps each labelled by source rather than forcing agreement.
Which stores are supported?
Shopify pulls live; other platforms connect by their available connectors or manual widgets — check the integrations directory.
How much does ReportingBee cost?
Starter is £9.99/month for your first client and £3.99/month for each extra client, capped at ten client slots (£45.90/month). The Agency plan is £49/month flat with unlimited clients.
Keep exploring
Ecommerce Reporting
Present Shopify orders, revenue and average order value alongside GA4 and ad-platform metrics. Keep each source labelled so the client can distinguish store activity from attributed results.
Marketing Reporting Dashboard
Sessions, spend, conversions and rates across every channel on one screen — a working overview for channel owners, not a vanity wall.
Client Reporting Dashboard
Each client's key metrics, shared report links and portal access in one controlled view — they see a curated overview, you keep the working detail.
Browse all reporting guides
Reporting
- Client Reporting Software
- Agency Reporting Software
- Marketing Reporting Software
- Digital Marketing Reporting
- SEO Reporting Software
- SEO Reporting for Agencies
- PPC Reporting Software
- White Label Reporting Software
- Automated Reporting
- Automated Client Reporting
- Ecommerce Reporting
- Analytics Reporting
- KPI Reporting
- Social Media Reporting
- Social Media Reporting Software
- Ahrefs Reporting
- Google Analytics Reporting
- Google Search Console Reporting
- Google Ads Reporting
- Facebook Ads Reporting
- Instagram Reporting
- LinkedIn Reporting
- Mailchimp Reporting
- Facebook Ads Reporting Tool
- Google Ads Reporting Tool
- SEO Client Reporting
- Marketing Agency Reporting
- Digital Agency Reporting
Dashboards
Your first branded report is minutes away
Add a client, connect their data and share a live report today.